For some time, we’ve been leading the industry in terms of planning and scheduling for electric fleets, both with regards to planning a mixed fleet (that uses both diesel and EVs) as well as all-EV fleets. This week we’ve released a new and improved EV module, with robust optimization that’s already yielding better results. To celebrate this, we decided to share an example of life at an agency before and after the EV planning module. But first, let’s see what’s new:
-
- A new optimization engine and the relevant EV preferences
- New capabilities specific to EV, such as maximum charging time, vehicle-only recharge events, and maximum state of charge for specific chargers
- New validations specific to EV, such as validations for battery capacity and minimum/maximum recharge time
- Manual editing with the same functionality as the rest of the scheduling module
- New metrics, such as a battery type stat and CO2 emissions KPI
Learn best practices for planning and scheduling electric buses
What can EV schedule optimization do for you?
To answer this question we’ve prepared a detailed example based on a recent experience.
An agency has 60 electric buses, serving 15 routes from one depot. Historically, it had used manual scheduling, but with the additional algorithmical challenges brought on by EVs, manual scheduling can’t work, as we will soon see. In the meantime, here are some details with regards to batteries and chargers:
- Battery Type: Lithium iron phosphate
- Capacity : Ranges between 324-591 KwH
- Discharge rate: 2.5-3.5 KwH/Mile
- Charging rate: 80-250 KwH
- Mileage: appx 115-165 miles on a full battery
- 2 types of chargers
- Fast – high energy consumption, wireless, located in layover locations
- Slow – low energy, usually used overnight, located in depot
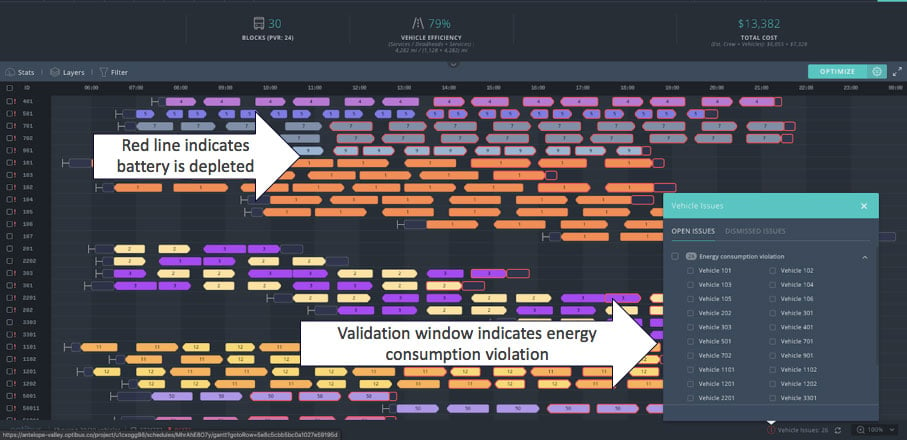
In this case, manual scheduling could not work for EV scheduling. There was no way of planning that reflected EV requirements – battery charging levels, charger locations, time to charge. As a result, the schedule did not reflect reality. In fact, drivers called dispatching when the battery was low and, in some cases, replacement buses were sent.
We uploaded the original schedule, as is, to Optibus, so the issues with the schedule can be easily shown. The red lines indicate trips where the battery is depleted. The validation window shows all the trips where there is an energy level violation.
Now let’s take advantage of the EV module and begin adding the preferences and charging events, through the EV preferences. Then we will and run an optimization. Here are the results: (the rectangles with the lightning sign indicate charging events, either quick charging or long charging).
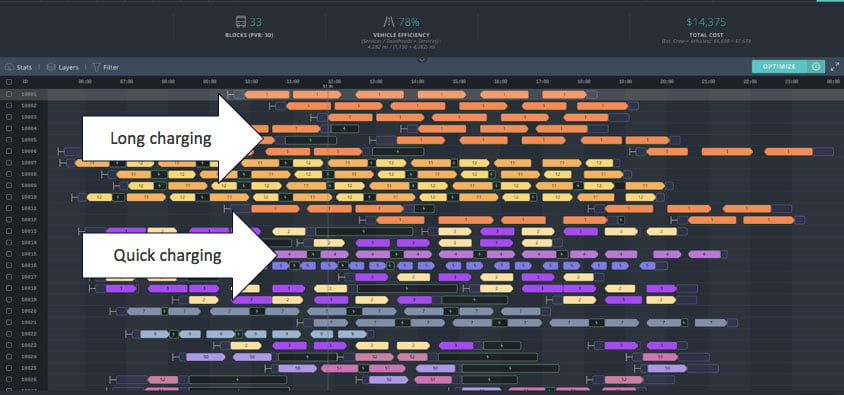
Now, the schedule reflects the realities of charging and stopping for charging. The PVR is now down from 38 to 32 (-15%).
This is just the first step. As the agency grows, they can use Optibus to answer questions such as where chargers should be located, how many chargers to purchase as well as test scenarios with different battery capacities.
Read more:
➤Planning and Scheduling for Electric Vehicles
➤What Artificial Intelligence Can Do for Public Transport: Myth vs. Reality
➤WATCH: Is Electric Bus Adoption Only About Finance and Engineering? What About Software?

