Continuous deployment in mission-critical enterprise SaaS software sounds scary, right? How do you make sure (as much as possible) that there are no regressions introduced when new code is being deployed in such critical pieces of software?
This is one of the challenges that we continuously face. The Optibus platform is used by the people in charge of planning and operating mass transit (public transportation), and they rely on our system to plan and execute the operation of moving millions of people on a daily basis. If we deploy a change in the code that introduces an issue that prevents them from working, the impact is huge. Moreover, what if the change causes a degradation of the quality of our algorithms in a specific scenario, a minor change that is only different by 0.5% from their previous efficiency levels? This difference may seem insignificant but can easily create excessive costs in the millions. Not to mention the environmental impact of inefficient operations emitting more CO2 into the atmosphere.
So how can you continue to ship at a high pace while de-risking the code you introduce?
Having good test coverage is not enough. Among other things, we are applying TDD (Test Driven Development) methodologies across our platform, but these are specifically engineered cases that are mainly used to build good code and have high coverage of lines of code. That doesn’t really cover all the endless combinations of real-data scenarios — and they never will since new combinations are born every minute.
One common approach to handle this is canary deployment, which works very well. However, it relies on a few things to make it work:
- Having a significant number of users that reach the same flows (edge cases) so you can really divert traffic in gradual ways and make sure you cover these cases
- The ability to detect problems very fast — mainly detect failures
- Having some of your users experience a problem as part of the process
In our case, none of the above are true. Our users are the people in charge of operating mass transit, so the number of our concurrent users is not in the tens of thousands. As a result, we don’t have a large enough group to statistically measure and cover enough edge cases in a very short period.
Detecting a non-trivial regression, such as performance degradation, for operations that can take a few minutes to run is hard. First of all — it is not an error, and how can you predict the expected run-time for this operation? Moreover, detecting a behavior change that yields a successful result (but with a slightly different output) is not trivial. In canary deployment, you monitor for errors to detect a problem — you don’t have an expected baseline since this is live data.
Finally, it is a mission-critical system. A user experiencing an error may not be able to serve the public in time, so we have very little tolerance for user failures.
Playback framework
With this in mind, we developed a different approach, which is similar to the “testing in production” concept but not actually in production. We created the playback open-source framework, which is a decorator-based Python library that records all the traffic in production for all of our Python-based services, intercepting all inputs and outputs of each of our different services independent of how the service is being invoked (HTTP, event-based, producer-consumer, etc.). These recordings are later fully replayable on new code versions as a standalone operation, not relying on any external data state. This allows us to do a full comparison between the recorded output and the playback output to check for regressions, degradations, fixes, or improvements.
What is a regression? This is not always as simple as just checking for equality on the outputs because its service has its own format of outputs. For instance, if an endpoint didn’t return an error but a result that is slightly different, is it a regression, an improvement, or just an equivalent result with different IDs? This is also where the “out of the box” canary deployment doesn’t suit well.
This comparison is done in the playback framework by using dedicated plugins for the different operation types, which have knowledge on what is considered an equivalent output, a regression, or an improvement.
The developer can use the framework to run playback of specific changes before merging, get specific recording samples that have properties s/he wants to test the code, and so on.
In addition, this framework allows us to sample enough recorded data from production that is uniformly distributed across the different customers and use cases — making sure we cover enough edge cases and user flows and replay them as part of our CI/CD on the new code version before we merge/deploy it. This way we are automatically validating that there is no regression and conducting complicated comparisons on short and long running operations. The result is that we are shipping code at high frequency without compromising on quality.
We are essentially “testing in production” without being in production.
Playback High Level Architecture
This is an applicative framework that you need to integrate within your code base in order to annotate the service entry points and the inputs and outputs that need to be captured. Its main components are:
- Tape Recorder — Records and replays entire operations
- Tape Cassette — The driver that is used by the Tape Recorder to store and fetch recordings
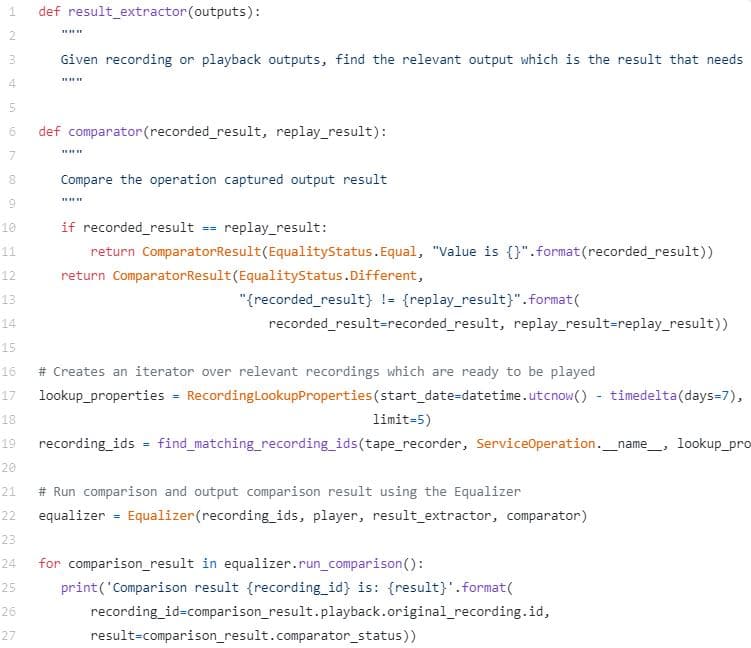
- Equalizer — Runs comparisons between recorded operations and playback results on new/different code version
- Playback Studio — A utility that makes it easy to run suites of regression checks of playbacks
You can see the full basic example of how to use the framework to capture an operation and play it back. Or an end-to-end example using flask as a web server.
This is a snippet that demonstrates how to plug the framework into the operation that you wish to record and playback:
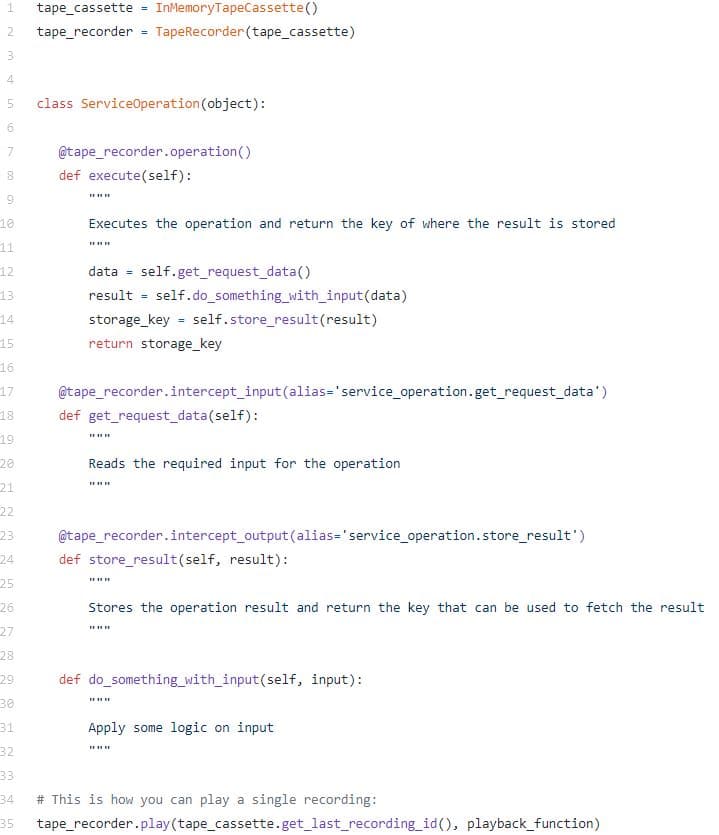
The InMemoryTapeCassette is useful for testing, but in production you would typically use the S3TapeCassette which uses AWS S3 to store and fetch recordings.
This is how you can use the Equalizer to run a comparison of many recordings:
You can check out https://github.com/Optibus/playback/tree/main/examples/flask for a more comprehensive example. Contributions are welcome.

